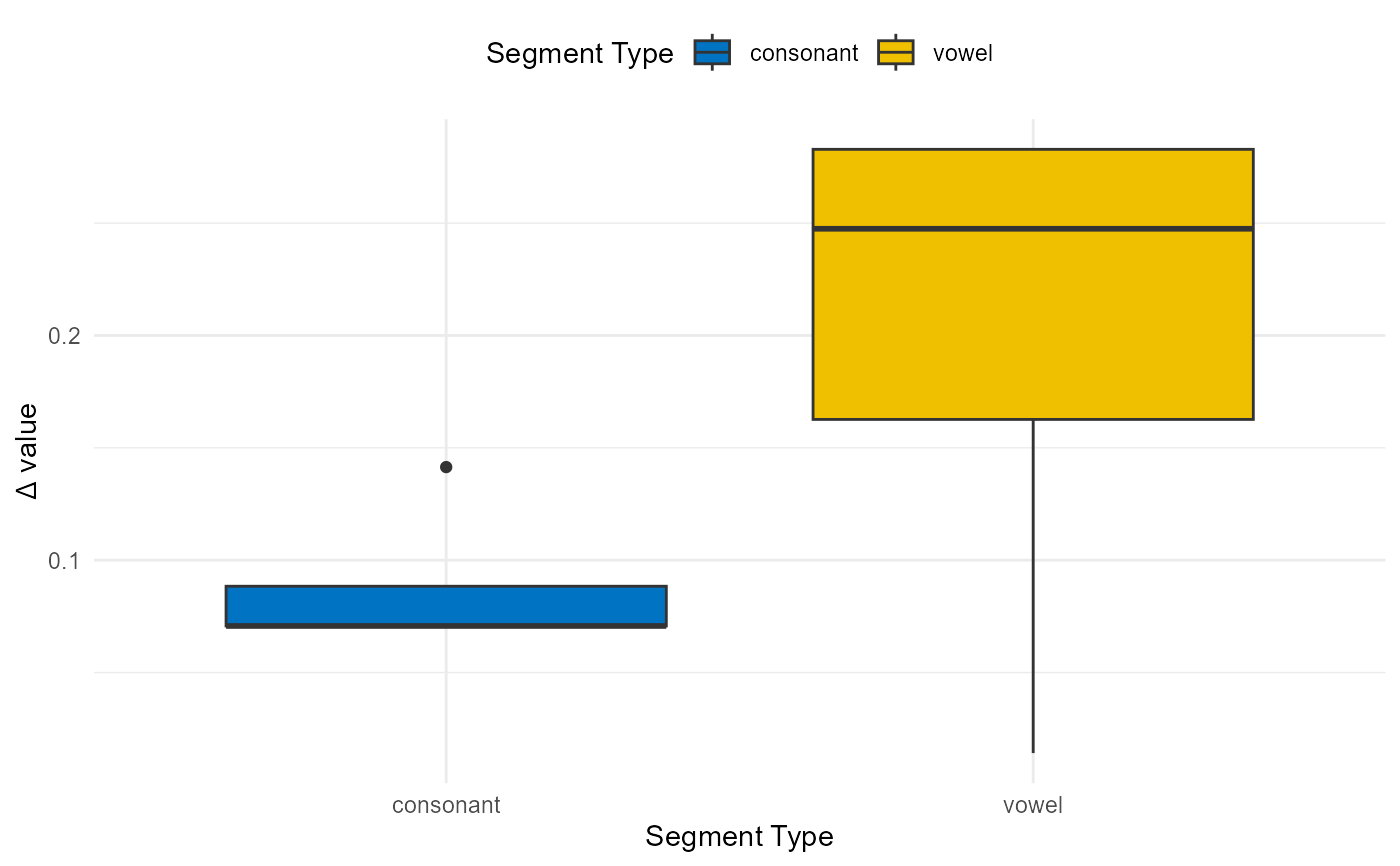
This function loads a dataframe as input and returns a box plot for Delta C and Delta V values.
Arguments
- df
a data frame containing cv_labels, utterance_id, and cv_duration values.
- cv_label
column name for segment type (C or V).
- utterance_id
column name for unique utterance IDs.
- cv_duration
column name for the duration of C or V.
- save_fig
default is
FALSE. Change toTRUEto save the plot.- fig_path
default is
NULL. Required ifsave_fig = TRUE.
Author
Cong Zhang, cong.zhang@newcastle.ac.uk
Examples
df_test <- data.frame(
  cv_label = rep(c("consonant", "vowel"), 8),
  utterance_id = rep(paste0("utt_", 1:4), each = 4),
  cv_duration = c(
    0.10, 0.80, 0.20, 0.50,
    0.30, 0.30, 0.40, 0.70,
    0.30, 0.88, 0.50, 0.90,
    0.30, 0.57, 0.40, 0.97
  )
)

plot_delta_cv(
  df_test, cv_label, utterance_id, cv_duration, save_fig = FALSE
)